Weather Explained
What two tide gauges show about the Outer Banks nor’easter
Seven days of NOAA observations show how Duck and Oregon Inlet Marina differed from predicted tides, and why easing wind does not guarantee normal coastal water.
The tide kept rising and falling at Duck during October 17–23. But the observed water level stayed above its predicted tide throughout the sampled record. At Oregon Inlet Marina, the difference was near zero for parts of the weekend, then grew through the following days.
That contrast is a useful way to read a coastal event. A tide prediction is one part of the water-level story. Where the gauge sits matters too.
What the forecast said before the weekend's main impacts
At 4:24 AM EDT on October 17, NWS Newport/Morehead City expected an offshore nor’easter to bring strong winds, high waves and coastal flooding through the weekend, potentially lingering into the following week. The discussion kept the eventual track and strength uncertain. This was a forecast of a prolonged event, rather than one high tide.
We preserved that October 17 discussion. The charts below cover seven full local dates, including the hours before that discussion was issued. They do not grade every part of its forecast.
Start with two lines at the same station
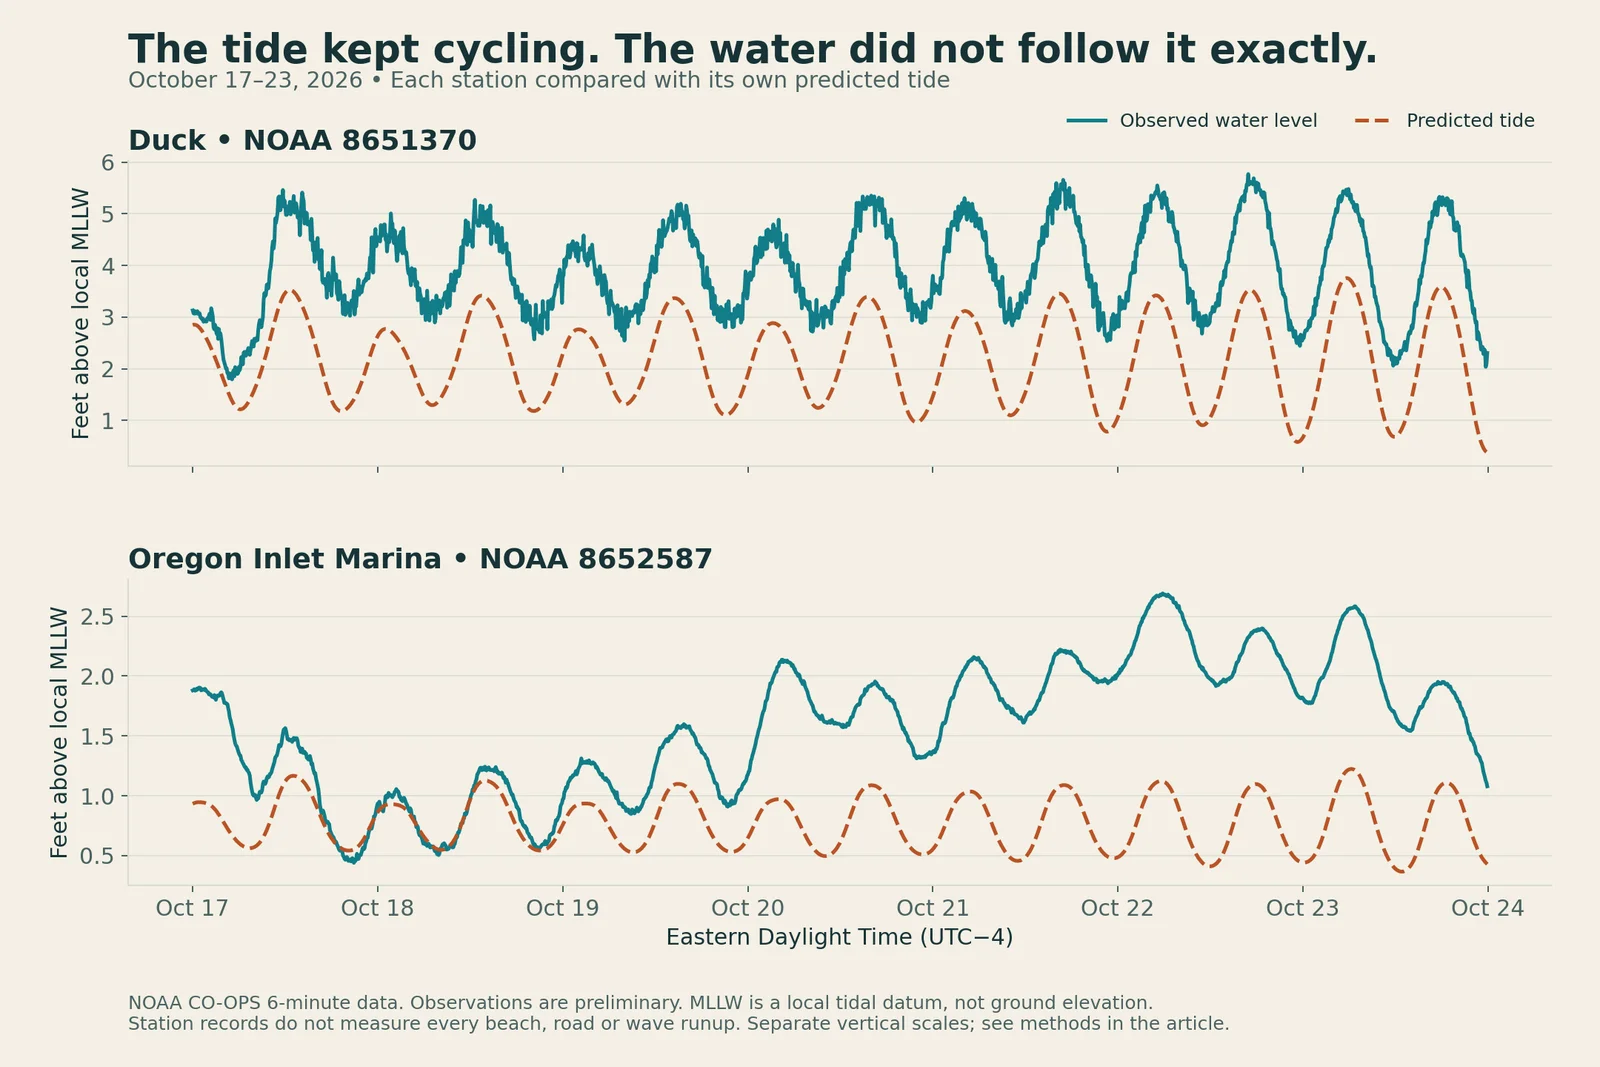
Solid teal is observed water level; dashed orange is the predicted tide. Each panel uses that station's local tidal datum and its own vertical scale. All times are EDT. Observations are preliminary NOAA data.
The predicted tide provides a baseline for the regular tidal cycle. Actual water levels can depart from it under weather and other non-tidal influences. Subtracting predicted tide from observed level gives a residual. A positive residual means the gauge recorded water above that baseline.
At Duck, all 1,680 matched six-minute observations in this window were above prediction. The daily median residual increased from about 1.6 feet on October 17 to 2.0 feet on October 22. It eased to about 1.6 feet on October 23, while remaining positive throughout that day's sampled record.
Oregon Inlet Marina told a different local story. Its daily median residual was about 0.1 feet on October 18, then increased to 1.5 feet on October 22. It eased to 1.3 feet on October 23. The quieter weekend reading did not describe the rest of the week.
Date (EDT) | Duck | Oregon Inlet Marina |
|---|---|---|
October 17 | 1.6 ft | 0.4 ft |
October 18 | 1.7 ft | 0.1 ft |
October 19 | 1.6 ft | 0.4 ft |
October 20 | 1.8 ft | 0.9 ft |
October 21 | 2.0 ft | 1.1 ft |
October 22 | 2.0 ft | 1.5 ft |
October 23 | 1.6 ft | 1.3 ft |
Daily median of observed water level minus predicted tide, rounded to the nearest tenth of a foot. These are sampled residuals, not peak flood depths.
The two records should not be collapsed into one Outer Banks water level.
Separate the tide's cycle from the elevated baseline
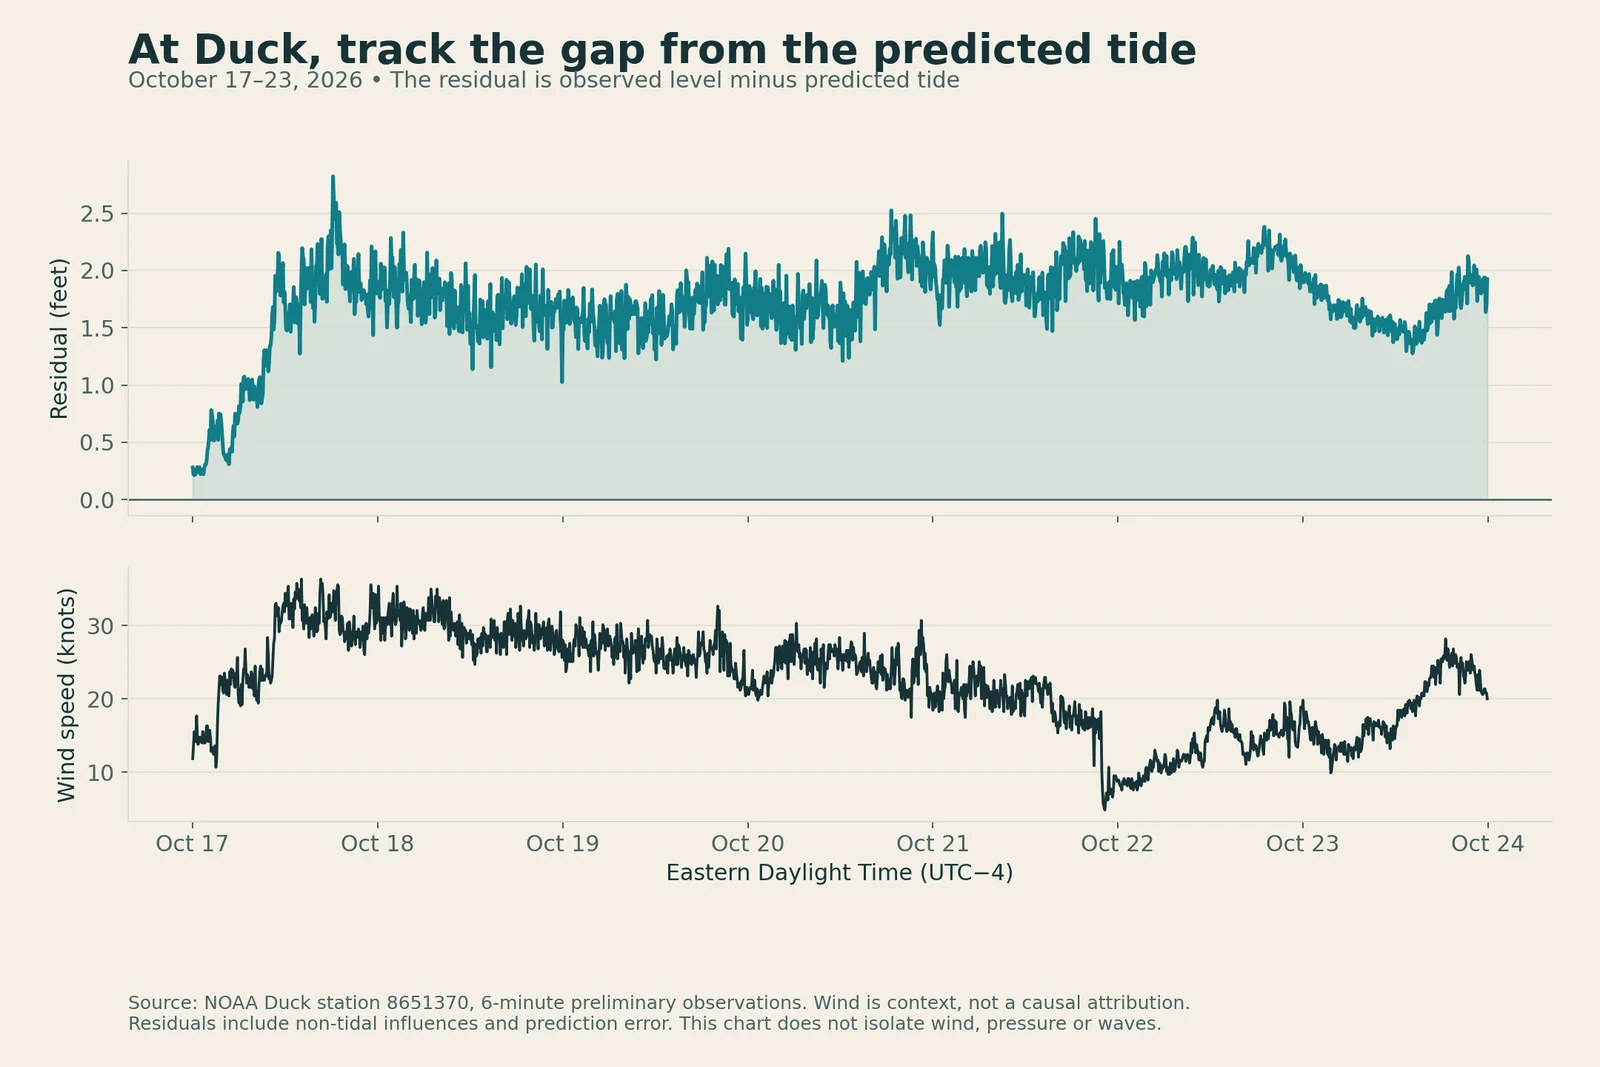
The upper panel subtracts the predicted tide from the observed level. The lower panel adds wind-speed context. Their association does not isolate the contribution of wind, pressure, waves or other influences.
At Duck, even the lower parts of the observed tidal cycle stayed above the corresponding prediction. Following successive cycles reveals persistence that a screenshot of one high tide can miss.
By October 22, local wind speeds were lower than during the weekend, while the water-level residual remained elevated. A drop in wind at one station was not the same as a return to the predicted tide. Winds increased again later on October 23. The lower daily median residual that day still did not mean the water had returned to its predicted baseline.
The wind series helps place those observations in context. It is not enough to assign a particular number of inches to wind or to infer the low's exact track. A residual also includes prediction error and other non-tidal effects.
A gauge height is not water depth on a road
The chart's vertical reference is mean lower low water, a local tidal datum. It is not the height of the road, dune or building you care about. The same number of feet on this chart cannot be read as that many feet of flooding above ground.
These gauges also do not measure breaking-wave runup on every beach. Duck and Oregon Inlet Marina are distinct observation sites, not interchangeable proxies for every oceanfront and soundside location.
The practical habit is to compare observations with predictions at one station, follow the pattern across several tide cycles, then consult official local impact and road information. A different gauge can add context; it cannot guarantee conditions along the route between them.
Data and limits
These charts use NOAA CO-OPS six-minute water levels, tide predictions and wind observations for Duck (8651370) and Oregon Inlet Marina (8652587). Values are matched at exact UTC timestamps and displayed in EDT. Water levels and predictions share the same local MLLW datum and feet units at each station. Wind speed is in knots. No gaps were filled and no smoothing was applied.
All 1,680 expected water-level/prediction pairs per station are present in this window. NOAA labels these observations preliminary, so later review and revisions may change the values. These charts describe this dated window; they do not establish the storm's final duration or total impacts.
What changed by publication day
The observation record above ends Friday night, October 23. In its October 24 discussion, issued at 3:13 AM EDT, NWS Newport/Morehead City warned of additional coastal impacts as northeast winds, higher seas and a building astronomical tide cycle continue into the following week. That is a newer forecast, separate from the seven days of observations plotted here. The easing in Friday's daily medians does not establish that coastal impacts are over. Check current NWS products and official road information before making plans.
Sources: NOAA data API, NOAA response and quality definitions, Duck station, Oregon Inlet Marina station and the NWS forecast linked above. For current coastal forecasts and warnings, use weather.gov.